Tutorial 3 of 7
Backlog, sprints and the burndown chart
Intermediate 7 min
Order the backlog, plan a sprint, start it, complete it with carry-over and follow its progress on the burndown, burnup and velocity charts.
Scrum teams work in sprints: short, fixed periods (often two weeks) with a goal and a planned set of issues. Trackwell's Backlog tab is where you plan them. A kanban project has no sprints; its backlog is simply the ordered list of work. You choose between the two under Project → Project details… (board type).
The backlog
The backlog shows the running sprint at the top, then the planned sprints, then the backlog itself. The order is the priority order: drag an issue up or down, or focus it and press Alt+Arrow up and Alt+Arrow down. To put an issue into a sprint, drag it there or choose the sprint in the row’s sprint menu. Each sprint shows its issue count and story points, so you see when a sprint is full.
On the right, Epics shows every epic with its progress.
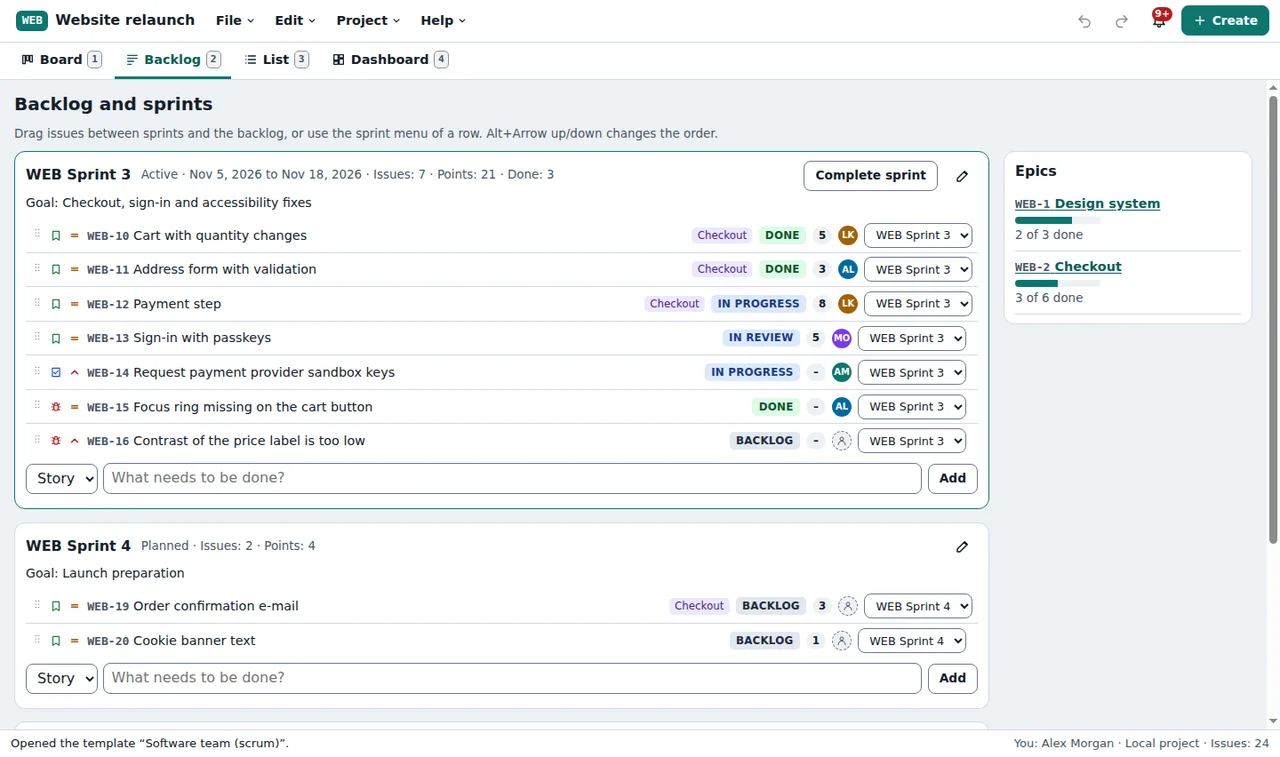
Type a summary into the field under the backlog to add an issue quickly without opening the create dialog.
Plan and start a sprint
Create sprint adds the next sprint (for example WEB Sprint 5). When it is planned, select Start sprint. Check the start and end date and write a sprint goal — one sentence that says why this sprint matters. Only one sprint can run at a time.
The board now shows the issues of this sprint.
Complete a sprint
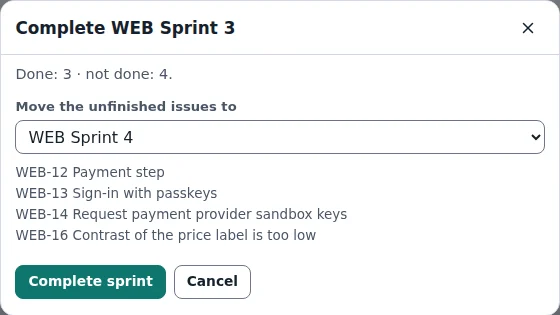
At the end, select Complete sprint. Trackwell counts the done and unfinished issues and asks where the unfinished ones go: into the next planned sprint, into a new sprint, or back to the backlog. Issues keep their history, so the closed sprint still knows what was planned, added, removed and finished.
Burndown, burnup and velocity
Open the Dashboard tab. Sprint burndown draws the remaining story points per day of the sprint next to the ideal line, and the burnup: completed work against the scope. When an issue is added after the start, the scope line jumps; the text under the chart names those issues. Choose another sprint in Sprint for the burndown to look back.
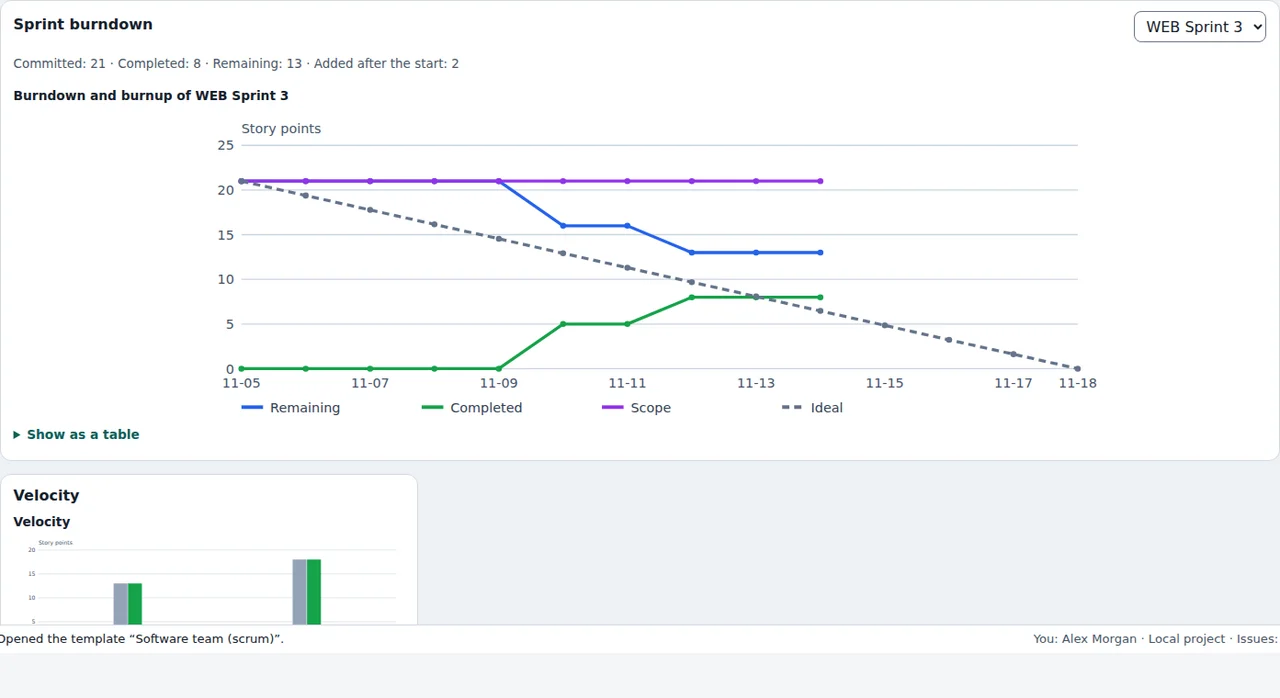
Velocity shows the committed and completed points of the last completed sprints — a better basis for planning the next sprint than a guess.
Every chart has a Show as a table button with the same numbers, for screen readers and for copying. The same burndown calculation is also available without the app as the tool Trackwell Sprint Burndown.
Ready to try it?