Tutorial 7 of 7
Jira import, CSV and Timeslice
Intermediate 6 min
Move issues from Jira into Trackwell with a CSV export, export issues as CSV, send your work log to Timeslice and read the dashboard charts.
Import a Jira CSV export
In Jira, search for the issues you want to move, then choose Export → Export Excel CSV (all fields). In Trackwell choose File → Import a Jira CSV export… and pick the file.
Before anything changes, Trackwell shows what it found: the number of issues, statuses, sprints, people and comments, every status with the category it was given and every issue type with its Trackwell type, plus warnings for things that could not be carried over. You can import the issues as a new project or add them to this project.
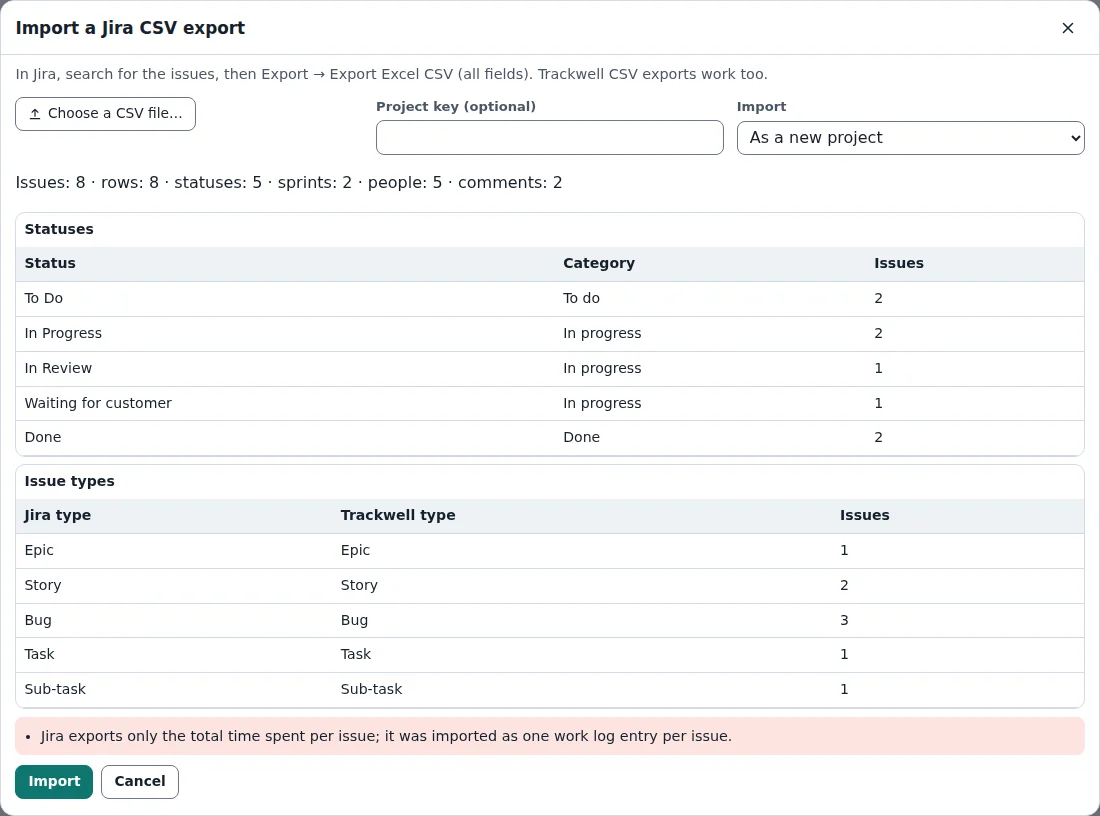
Issue keys, parents and epics, sub-tasks, links, sprints, labels, components, versions, estimates, story points, comments and custom fields come along. Jira’s wiki markup in descriptions is turned into Markdown. Jira exports only the total time spent per issue, so it arrives as one work log entry per issue. Attachments are not part of a CSV export.
If a status lands in the wrong category, fix it afterwards under Project → Workflow…. The same conversion runs as the tool Trackwell Jira CSV Import if you want to check an export first.
Export to CSV
File → Export issues as CSV writes every issue with its fields; Export CSV in the List tab writes only the issues of the current query. Spreadsheet formulas are disarmed in the file, so a summary that starts with = cannot run as a formula. Trackwell can read its own CSV back with the Jira import.
Send your work log to Timeslice
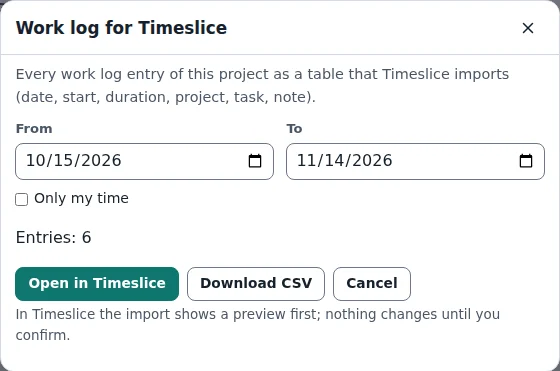
Timeslice is the time-tracking app of this site. File → Export the work log for Timeslice… collects the work log entries of a date range — all of them, or Only my time — as a timesheet table with date, start, duration, project, task and note. Open in Timeslice hands it over directly; Timeslice shows a preview before it adds anything. Download CSV saves the same table as a file.
The dashboard
The Dashboard tab collects the charts of the project:
- Created vs resolved — issues created and resolved per day or week. A growing gap means the backlog grows.
- Sprint burndown and Velocity — see Backlog, sprints and the burndown chart.
- Cycle time — one dot per resolved issue: the days from the first in progress status to the resolution, with the median and 85th percentile.
- Workload — open issues per assignee, split into to do and in progress.
- SLA breaches — incidents and requests that missed a target, and the next deadlines.
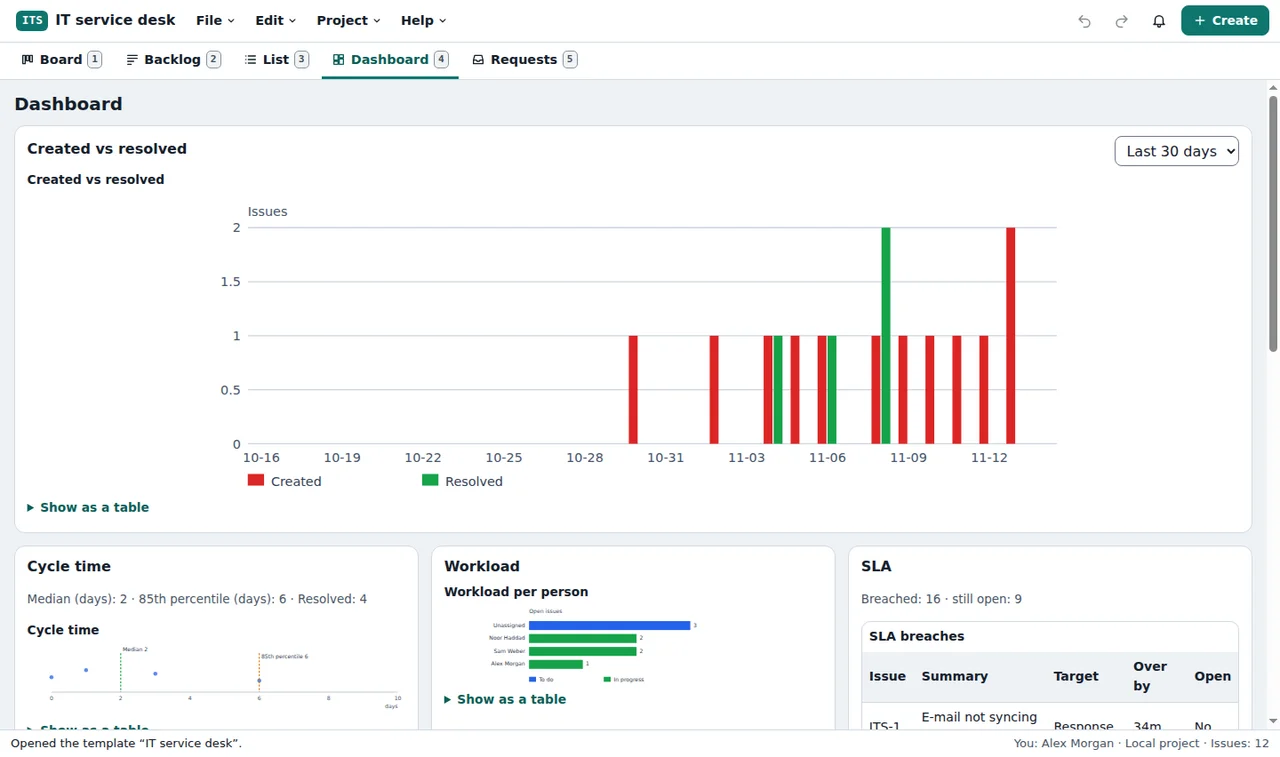
Choose the time range at the top. Every chart has Show as a table with the same numbers.
Ready to try it?